This is article #3 in my 16 part series summarising Tauranga City Council strategy documents.
Just so you know, there was a lot of overlap between:
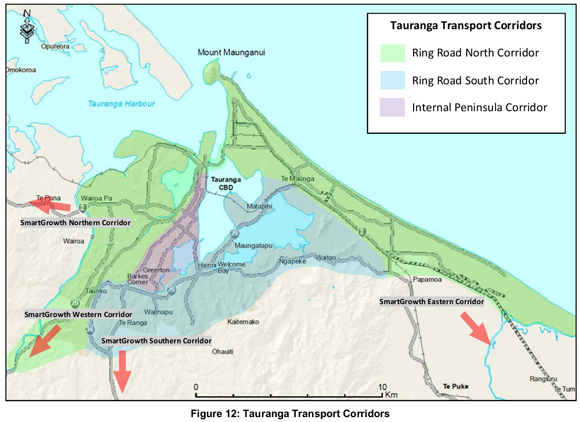
- this document, the Tauranga Transport Strategy 2012-2042
- and the Tauranga Urban Network Study (TUNS)
- 110 pages. 5.94Mb .pdf
- The TUNS is a joint study between Tauranga City Council, Bay of Plenty Regional Council, Western Bay of Plenty Council and NZTA and was published in 2013 (a 1 year or 2 after this document)
Those documents together were 271 pages, a huge 27% chunk of my reading.
My notes below focus on the TCC strategy, not the TUNS.
This was my another very exciting strategy document. I was fascinated.
I found it exciting for 3 reasons:
- It looks 30 years into the future, and barring another Global Financial Crisis, growth in transport is fairly predictable
- Our city is under enormous growth pressure and we have 3 choices:
- Allow our transportation to buckle and cease up with lack of attention and investment
- Take on debt to build and invest in anticipation for increasing demand
- Explore the alternatives before leaping into using the “just build more roads” strategy
- But the #1 reason I found this document enormously exciting is that I think our priorities are wrong
I was shocked when I read the following paragraph for the first time:
“the issue of continuing residential and commercial growth undermining efficient access to the port and commercial centres is of the highest priority. Other issues identified are a lack of clear progress in improving road safety, accessibility/ reliance on non-car travel modes, and issues of network resilience.”
I’m a business man, I know how important the economy is, but is safety and non-car travel less important than commercial growth?
No. No. No.
With those priorities we will jam up our roads with cars carrying 1 person just like Auckland has, and less people will choose public transport or walking or cycling.
During my interview with Vickie Buck, Deputy Mayor of Christchurch, she told me about Christchurch’s Transport Plan which is to “Keep Christchurch moving forward by providing transport choices to connect people and places”.
Here’s a paragraph from that document:
“… to improve travel choice by creating safe environments; easy pedestrian crossings and attractive public transport infrastructure, while strengthening regional connections to the Central City, building increased resilience into our infrastructure and delivering reliable freight connections to the ports and freight hubs”
Wow. That’s more like it. Can you see how the priorities in this statement a completely reversed to Tauranga?
Read just the first 4 pages of the Christchurch Transport Strategic Plan 2012–2042 (4.82Mb .pdf) and you’ll see what I mean.
So, I’d like to see our document re-written with it’s priorities reversed.
One complicating factor that will make that hard is that Tauranga is New Zealand’s busiest port, and as such decisions have been made up to this point to encourage growth in that area.
That aside, let’s look at cycling for a moment.
Cycling
Could Tauranga become the most cycle friendly city in NZ? Could more people on bikes reduce congestion and parking problems and improve health and wellbeing?
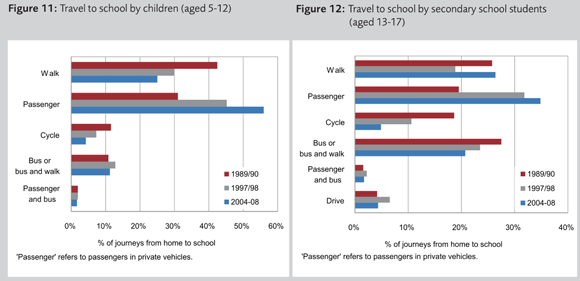
Look at the the decline in kids cycling to school in the following data. It’s because the more cars on the road the unsafer it becomes so the more parents drive their kids to school instead. It’s a downward spiral:
Do you think we should make our streets safer for walking and cycling?
Do you think we could get 1000s of school kids riding to school everyday, and take 1000s of cars off the street?
Let’s look at Buses next.
Buses
Imagine yourself on the way to work stuck in rush hour traffic. Off to your left a bus full of happy people rolls past all the traffic in its own dedicated lane. And then another, and another. Would you think to yourself “man, what am I doing in this car? I’ll join them tomorrow!”
Allow me to wave a magic wand for a moment: Imagine all the buses are free, that they all have their own dedicated lanes, and they pick you up from outside your house and drop you outside your work. Sound good? Would you use them then?
Sorry, I don’t have a magic wand, but let’s look at dedicated bus lanes for a moment.
Do you know what the tipping point is for adding a bus lane to a road (eg Hewletts Road)?
“Bus lane viability is often based on an assumed person throughput of 1000 people per lane per hour at which point the person carrying capacity of the bus network (20 buses per hour with an average occupancy of 50 people) is equal to that of a vehicle lane (800 vehicle lane capacity and an average car occupancy of 1.2 people)”.
The thing I don’t understand about this calculation is that on open day of a new bus lane with, let’s say, 4 buses per hour, the buses are carrying 4 x 50 = 200 people which is far short of the target of 1000 people. How could a bus lane ever be justified using these measures?
When we hear the term “public transport” we think “buses and trains”. But this definition is starting to change. Let’s include, Taxi’s and Uber for starters, but think about autonomous vehicles for a moment. Imagine none of us owning our own vehicle, and being able to summon a self-driving car from the kerb whenever we need one, for a few dollars.
Maps
Next, I want to show you 5 maps that I found hugely interesting.
This first one shows the age of existing housing, and where houses of the future will be:
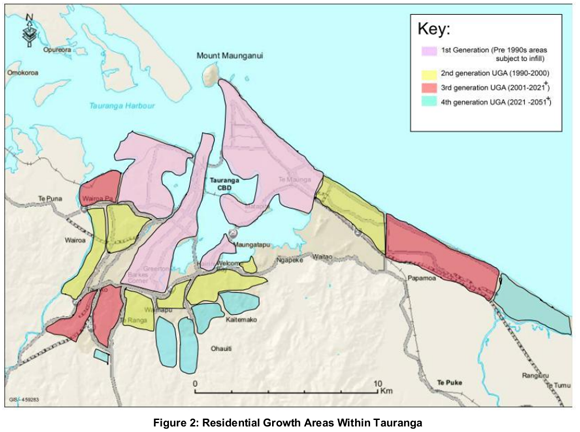
Te Tumu, known as “East Papamoa” is shown on the right. That is a 30km into the CBD. Even with the latest electric bike that is 1 – 1.5 hour ride each way, so this kind of sprawl is sure to add to traffic congestion. But if more people lived near their work, that would make a huge difference.
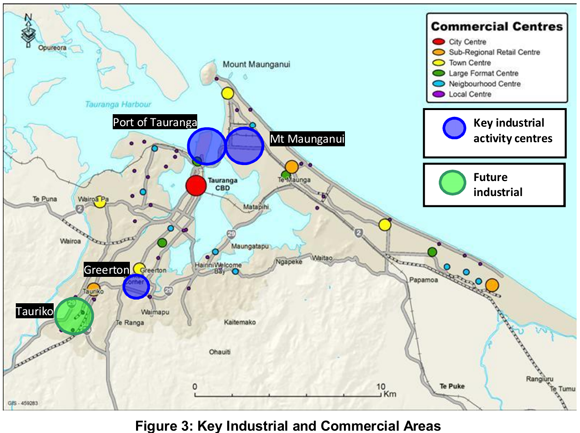
This second one plots commercial centres (I’m particularly curious about the “sub-regional retail centre” planned for Papamoa East).
This third one shows how far ahead congestion can be foreseen:
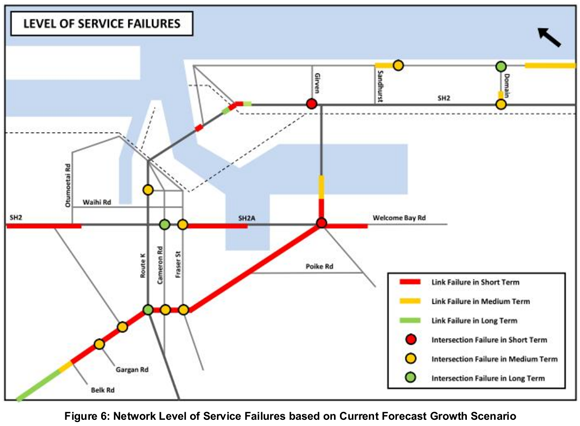
This fourth one identifies the roading priorities (and explains why the situation for Welcome Bay residents travelling into the city is unlikely to improve in the next 10 years):
The document also includes:
- A map showing every pedestrian injury
- A map showing every cyclist injury
- A very brief discussion of our bus network (I would have like to have seen much more detail)
- A map of our cycle network and identification of missing walking/cycling connections which is in progress
Let’s look at parking next.
Parking
“Effective parking management strives to provide the right amount of parking, in the right place, and at the right price in order to adequately serve the needs of vehicle users while minimising costs to the community.”
“International best practice suggests that a parking occupancy level of around 85% represents the ideal situation where a space is general available for any arriving vehicle but there are not either large numbers of available spaces, or a large number of circulating vehicles.”
Imagine if every carpark in the city had a sensor to detect if it was empty or not (or if the engine was running and someone was about to leave). Imagine if your car dashboard (or Smartphone) could reserve the best carpark for you and take you there.
That’s where we are headed, but until then finding a car park is frustrating, and time consuming.
Finally, let’s look at rail.
Rail
Firstly, the document assumes ongoing growth in the movement of logs to the Port.
“Failure to protect and invest in rail to cater for the increased demand associated with the expected expansion of the port will inevitably lead to increased demand for inter-regional freight trips and a rise in truck movements on the road network into and across Tauranga with associated congestion and safety issues for the local community.”
That’s it.
I would have liked to have seen some mention of passenger services, some exploration of the option of adding light rail to connect The Mount, Tauranga CBD and Papamoa, or discussion on the idea of moving the rail line away from the waterfront in the CBD.
In my own research I discovered just how expensive light rail is. It costs about $100,000 per metre! (Source: https://en.wikipedia.org/wiki/Light_rail).
Imagine yourself taking a few steps alongside a small section light rail, just 10 metres. You just spent $1M.
But then again, compare that to $40,000 per metre for a new 4 lane road (eg the Tauranga Northern Link budget is $286M for 6.8km. Source: http://www.nzherald.co.nz/bay-of-plenty-times/news/article.cfm?c_id=1503343&objectid=11627072).
I love the idea of rail, but I don’t see it in Tauranga’s future in the next 50 years using current technology.
Your Thoughts?
What do you think of my notes? Anything that catches your eye? Have your say in the comment section below.
Some really interesting points there Sheldon. I completely agree that our priorities are a bit wonky, especially when you compare the Christchurch statement (and lots of overseas examples). Fossil fuel powered cars are still important right now, but they’ll soon be the past, so our transport infrastructure planning needs to incorporate much greater emphasis on genuinely safer cycleways for school children and commuters, increasing rail’s share of freight, and fast uptake of electric vehicles of all types. And even more critical: much better urban development, as that is what triggers a lot of the problems we have now, such as the lowest levels of cycling and walking in the country. (see p35 Urban Network Study)
Thanks Glen 🙂